


In this article I’m going to explain how I managed to create the template for the budget manager and the main logic behind each component.
The home dashboard
I wanted the home page to be a sort of dashboard that allowed me to have an overview on the overall situation from which it’s easy to access all the other subpages.
We’ll see how to obtain the actual plots in the next post dedicated to the code automation, so I won’t say much about those.
To realize the top navigation bar I used a combination of two dividers (/div) and I combined the subpages in columns, giving the elements a grey background so they resemble buttons.
Monthly income partition
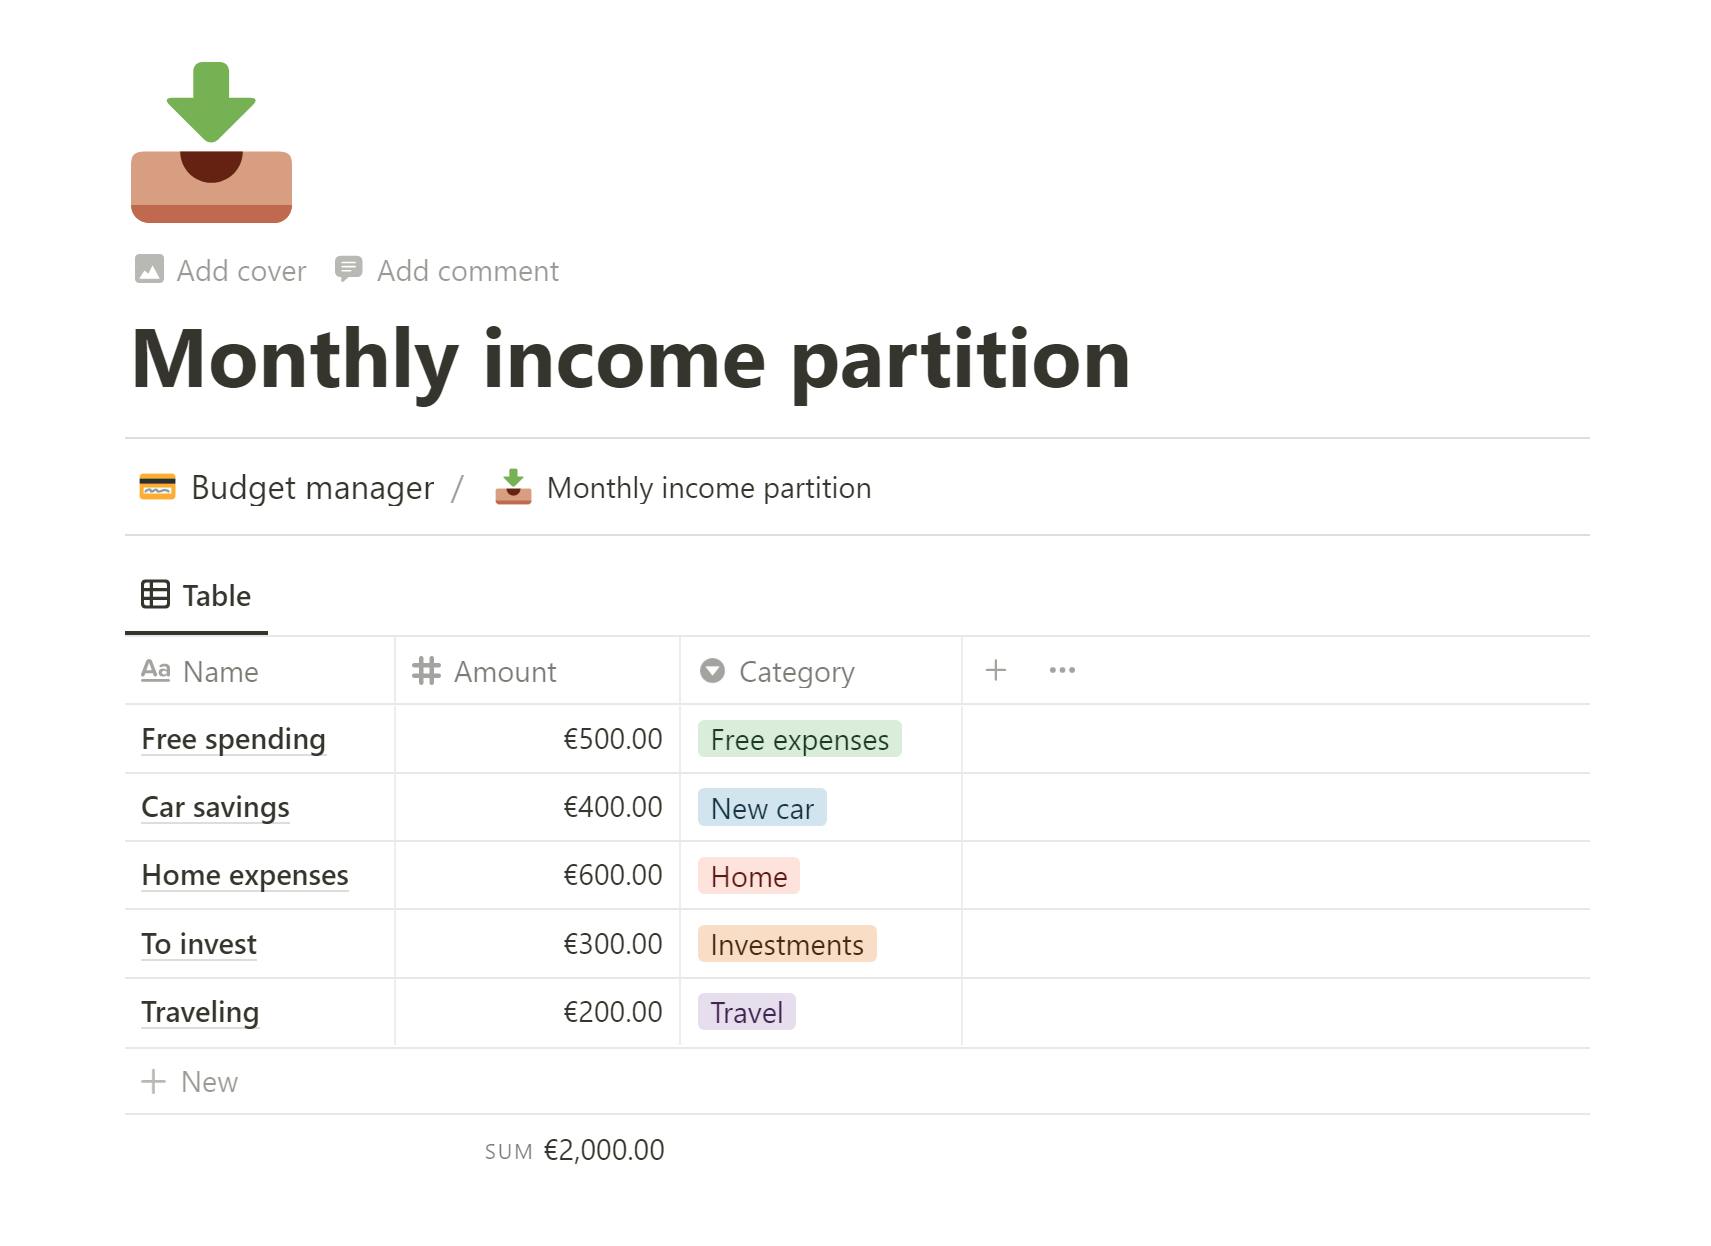
This page is very simple - aside from a breadcrumb element useful for navigation, it contains only a database with a table view.
The idea here is to obtain a partition of the average income over one month, answering the question “where do you want your money to go?”. As an example, I picked an arbitrary monthly amount of 2000€ and divided it in 5 different categories, represented as elements of a select type of column. We can check that our partition sums up to 2000 by using the aggregating sum function on the column “Amount”.
Income tracker
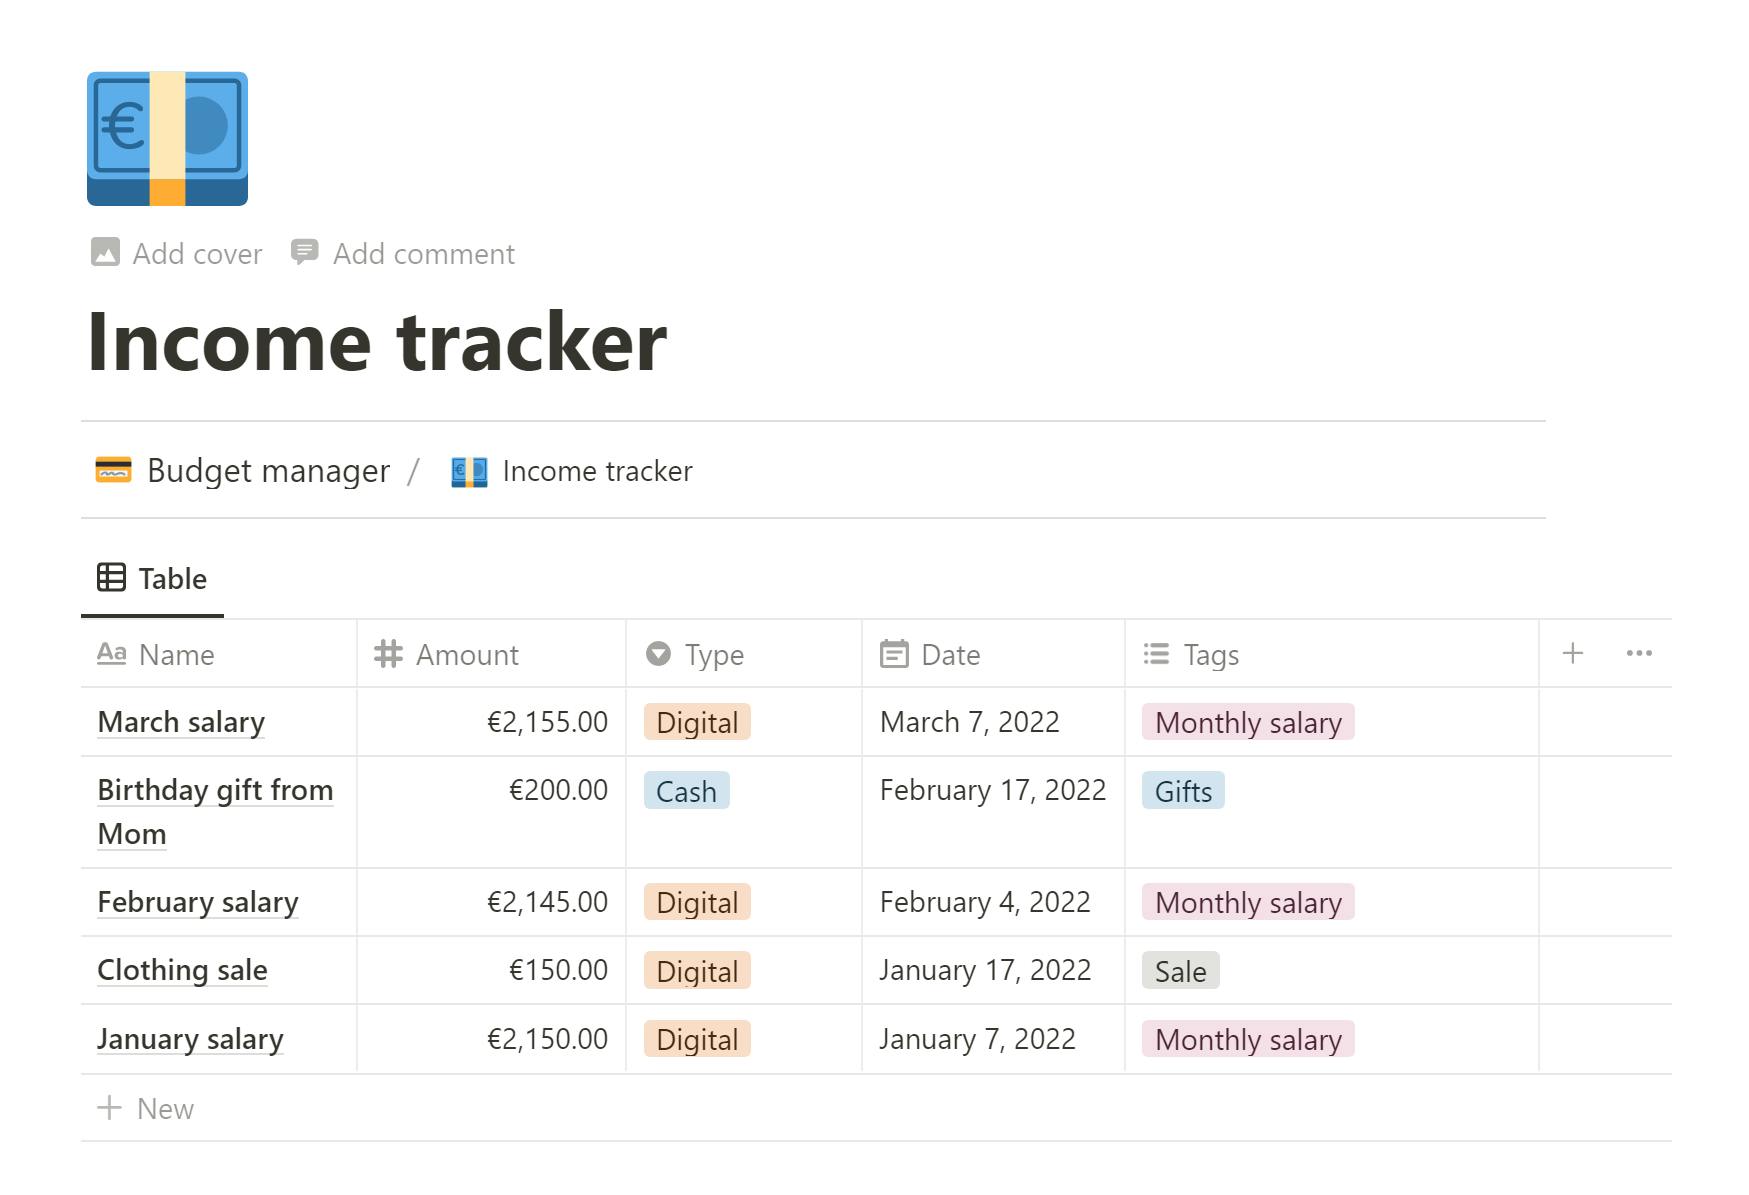
Again as before, very simple page in the structure, contains a database to register all sources of income - besides name and amount, I found it useful to add also a “type” column, to record the mean of payment (either cash or digital), the date when the money was received, and a last column “tags” which could be useful for computing statistics yearly.
Free expenses limits
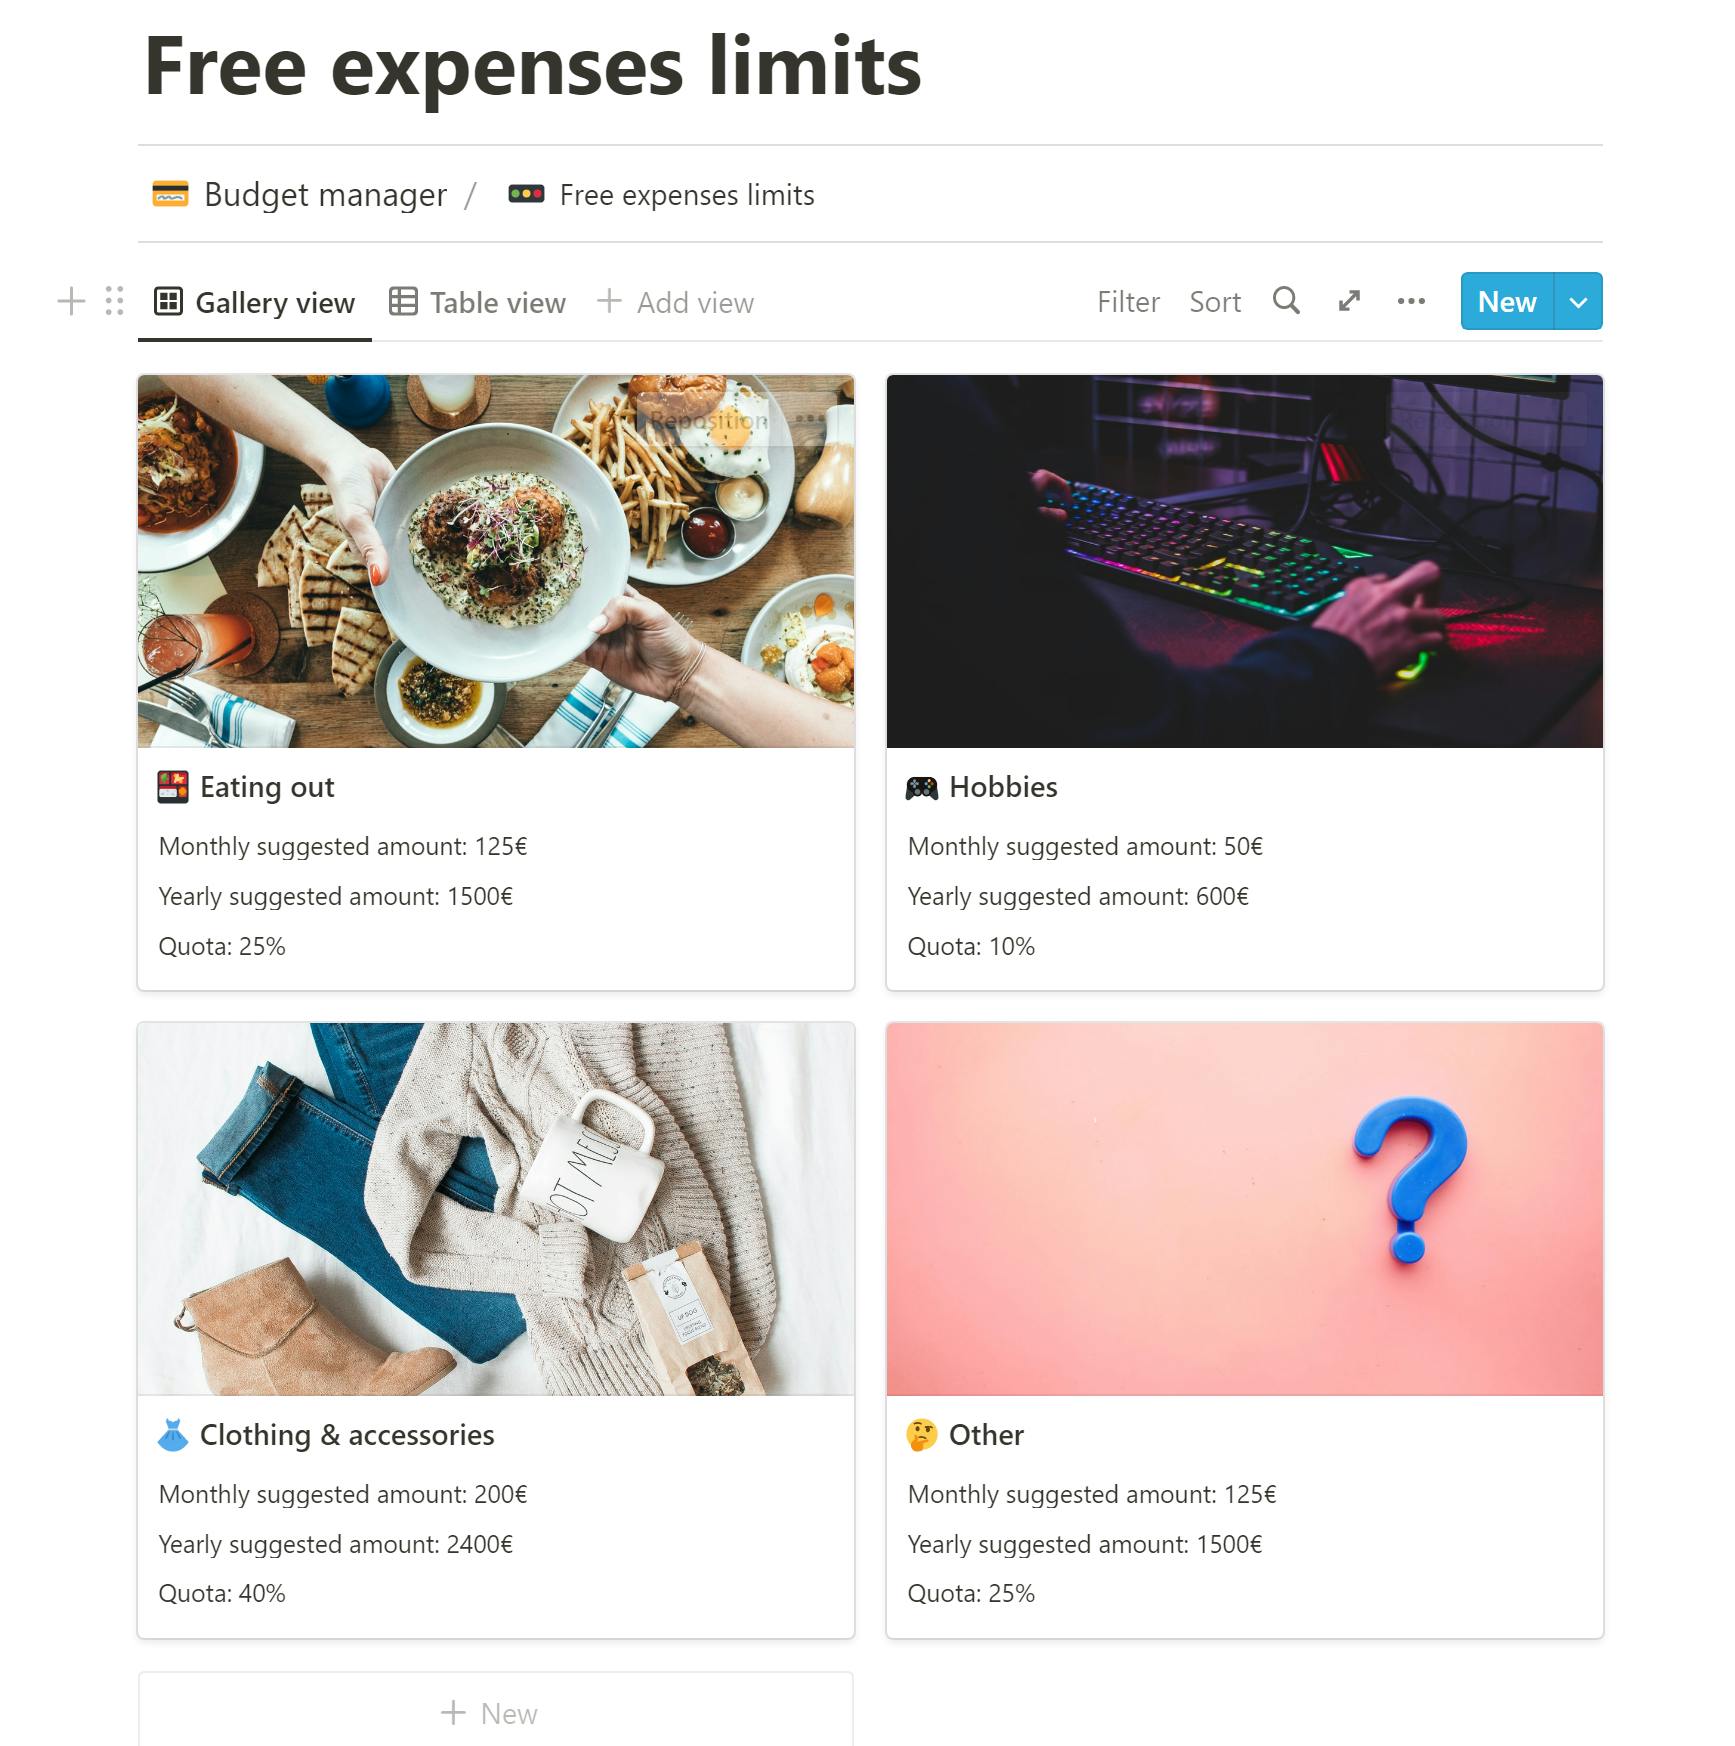
I decided to organize this page as a visual gallery of categories with relative suggested monthly and yearly limits. To do so, I created a new inline database with a gallery view and set the following properties:
Free expenses quota: a number that expresses the percentage of the monthly income dedicated to free expenses to allocate to this categoryMonthly income partition: since the amount of money that we reserve for free expenses could very well change over time, we really don’t want to manually update every element of the database each time. What we can do instead, is setting this column to the type “relation” and select the monthly income partition database, so the actual amount will be looked up automatically as we update that database.FE monthly total: the column of type relation, however, holds ONLY the reference to the database, not the value we’re interested in. To obtain that, we need a column of type “rollup” - we can then click on the cell and choose the columnMonthly income partitionas relation,Amountas a property andSumas an aggregating function.Max monthly amount: this column holds the actual limit suggested per month, and we can avoid computing it manually by choosing a type “formula” for this column. The formula itself is pretty simple -FE monthly total*Free expenses quota. We can format the output as currency by setting the number format.Max yearly amount: again a column of type formula which simply calculatesMax monthly amount*12
Now let’s fix a little the aesthetic part.
In gallery view you can actually decide what is shown in the card and how they are arranged by clicking on the 3 dots in the top right corner and selecting “Layout” - to obtain this layout I set “Card preview” to “Page cover”, “Card size” to large and deactivated the other 2 options. However I wasn’t really satisfied with how properties were shown on the card, so I added a few extra customization steps.
First of all, by clicking the 3 dots, it is possible also to decide which properties you’re interested in showing - I am interested only in the name of the category, the monthly limit, the yearly limit and the allocated quota. Even by doing so, however, Notion does not automatically show the name of the property next to the displayed value, so you’re left wandering what is what. To fix that, I added 3 extra properties to the database:
- Displayed monthly
- Displayed yearly
- Displayed quota
These properties are all formulas that simply concatenate a string with the actual value of the corresponding property.
Expenses tracker
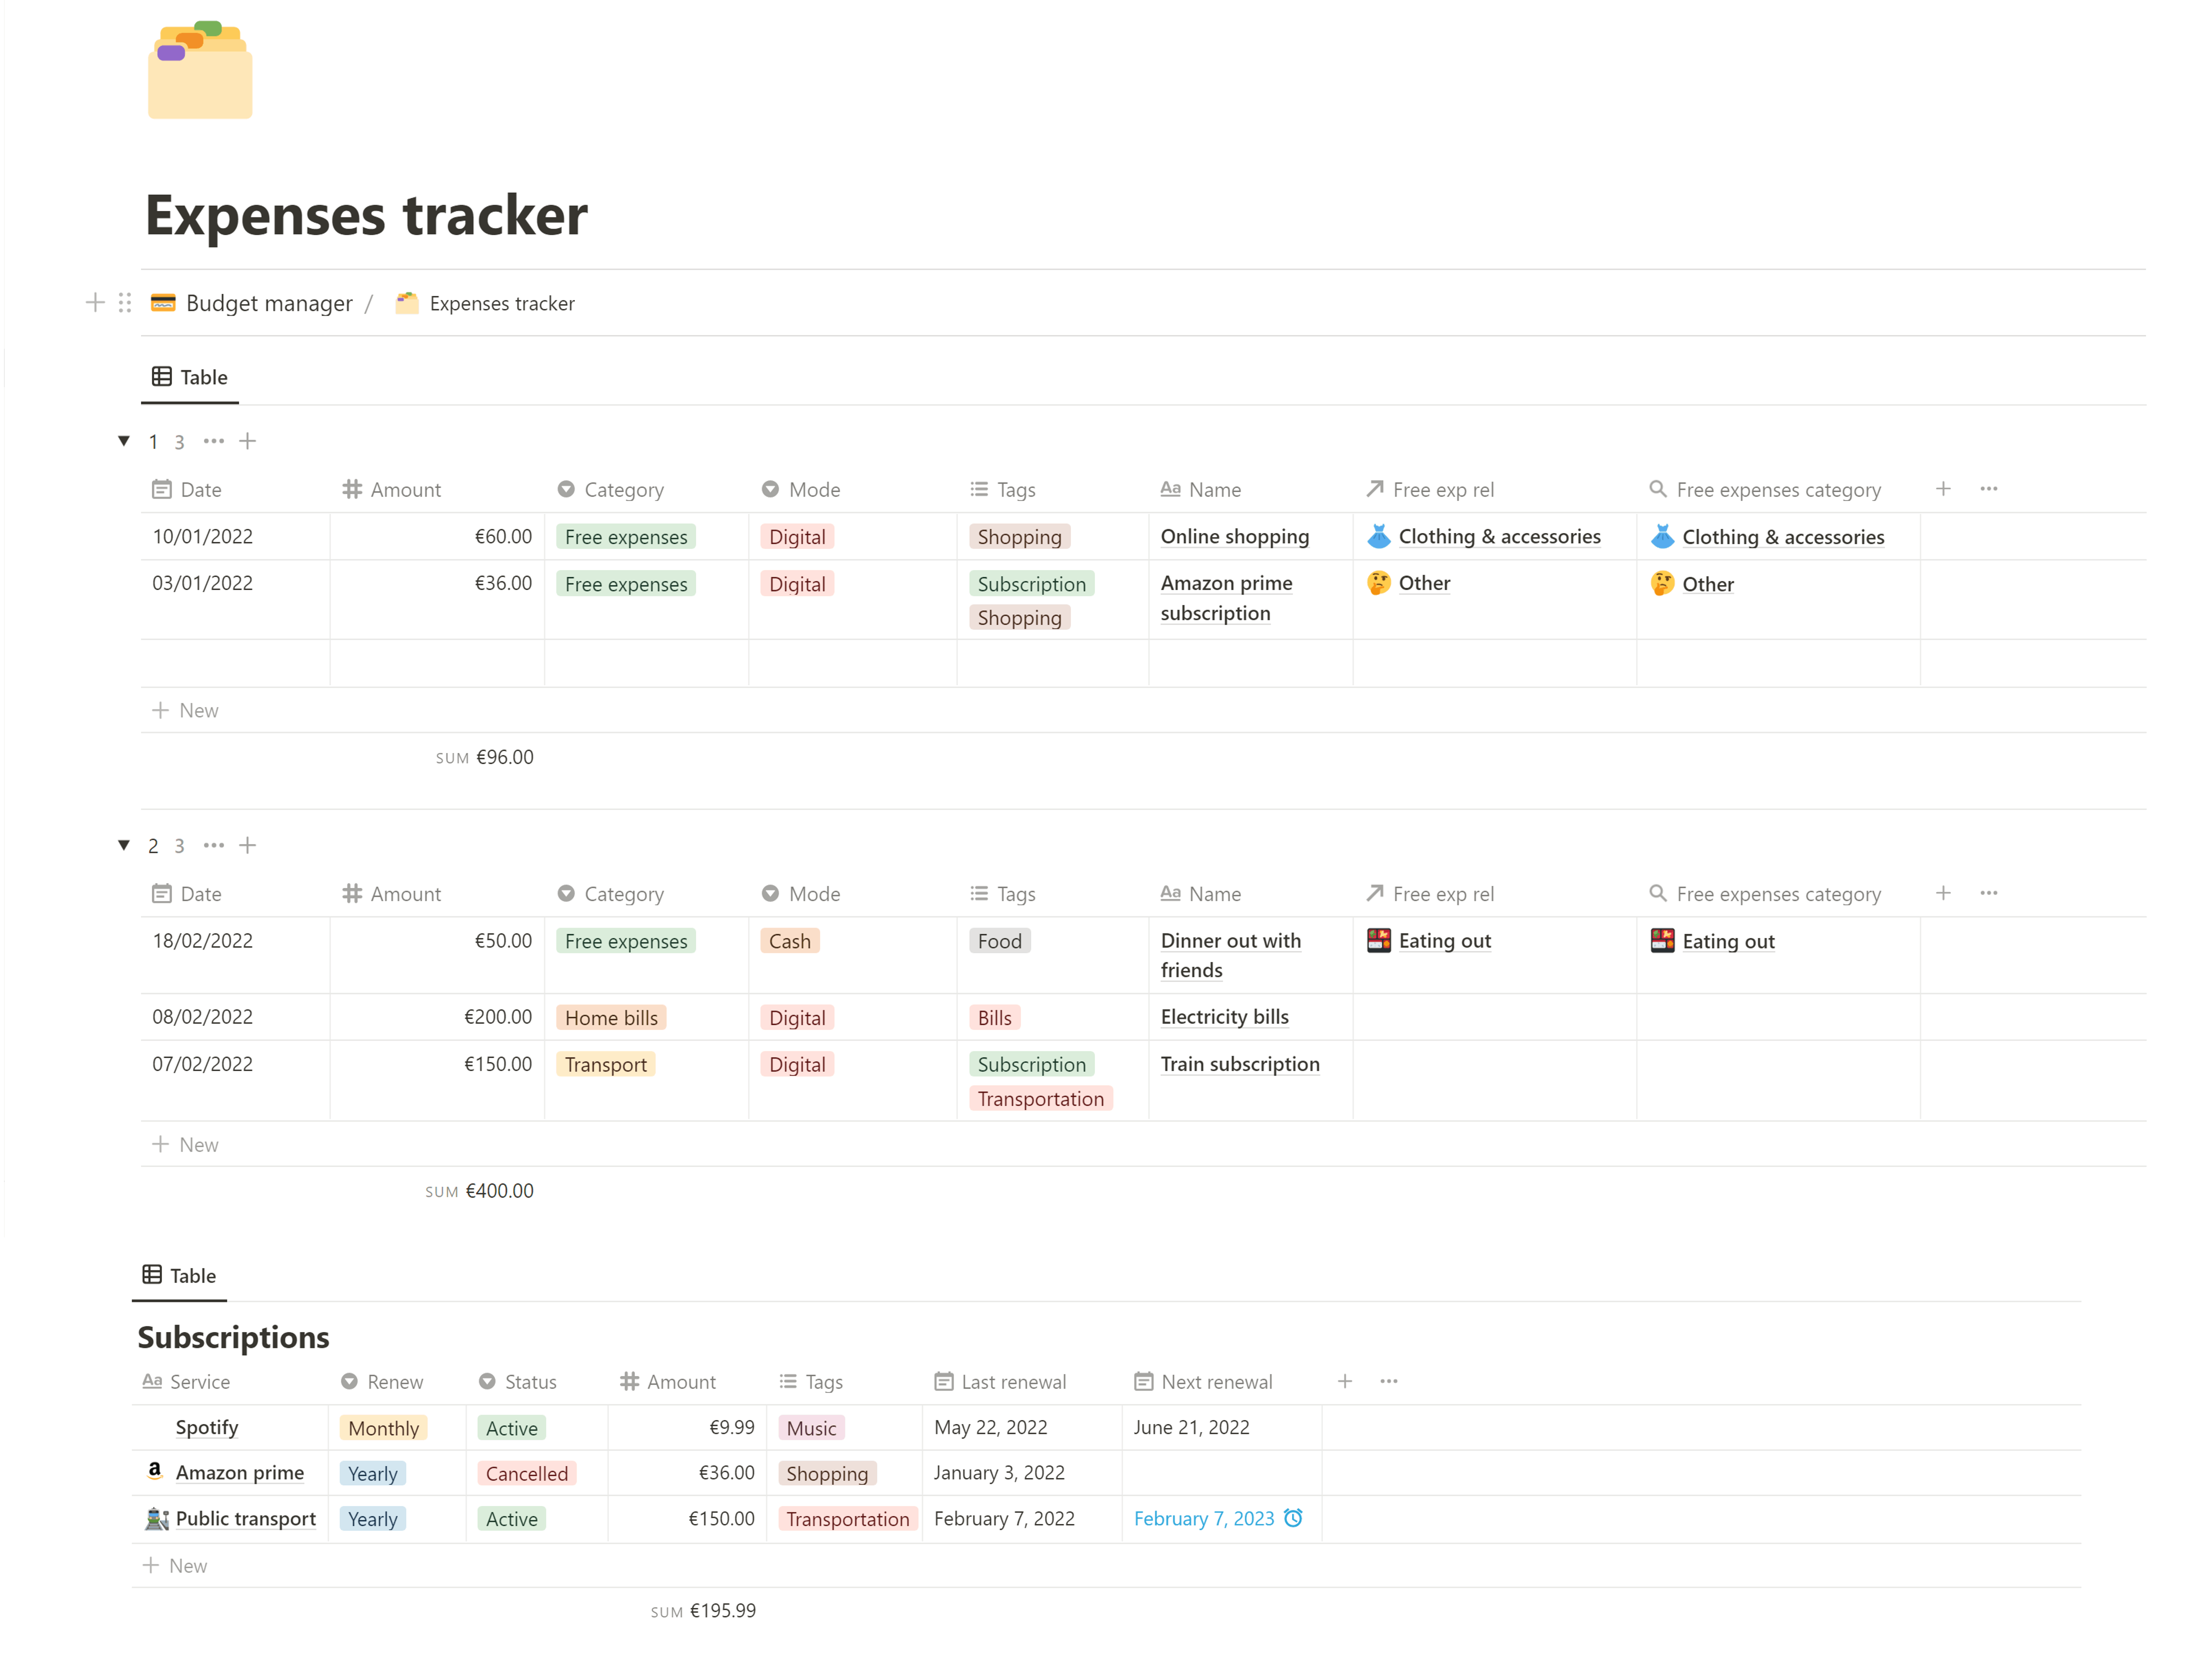
As the core of the budget manager, this page is meant to contain a database of all expenses and also contains a sub-section dedicated to subscriptions.
The main database has 9 properties in total:
Name: this is a name given to the single expense record, it is not really useful besides offering insight on what the expense was aboutDate: the date of the purchaseAmount: the amount expressed as a number and formatted as currencyCategory: category is a “select” type of column, and as the name suggests it is used to categorize the entriesMode: contains information on the modality of payment (digital/cash)Tags: contains more refined categorization, for this reason this column is set to “multi-select” instead of “select”Free exp rel: this is a column of type “relation” - this property should be set only for those records that belong to the category “Free expenses” and a proper free expenses category should be selected accordinglyFree expenses category: is the rollup column associated withFree exp relthat allows to extract the name of the category - this is going to be useful for generating the dashboard plotsMonth: finally, month is a simple formula property that extracts the month from the date for visualization purposes only - set to hidden by default
To further enhance the visuals, we can click on “Sort” in the top right corner and order the expenses according to the date, from the most recent to the least recent. After that we can go to the 3 dots icon and select “Group”: we’re going to group by the column “Month” and sort it alphabetically (month is converted to a character by the formula). In this way, we obtain a database that is partitioned by month - this is useful if we want to check, for example, only the last month and not clutter the page with all the past months records: to hide previous months, it is sufficient to click on the 3 dots near the group name and click on “hide”. Finally we can obtain some useful summaries in this visualization - computing the sum of the column “Amount” will let us know the total amount for that month only and selecting an aggregation function for the group (by clicking next to the name of the group) can let us know, for example, the number of transactions or the average amount.
Finally, the database “Subscriptions” contains records about subscription services with the associated info - name of the service, renew period (monthly, yearly,…), the status (active, cancelled, etc..), the amount to pay, associated tags for categorization and finally the dates of the last renewal and next renewal. Cancelled subscriptions should leave the last property empty.
This table is really useful if you, like me, are a forgetful person because Notion has an awesome feature that allows you to set reminders, so you can avoid accidentally renewing a service you’re not using anymore.
We’re going to automate the renewal task with Python in the next post - the idea is that the renewal dates are updated automatically and the corresponding expenses records are inserted in the expenses database without having to do it manually. NOTE: sadly, Notion API does not allow, at the moment, to set reminders, so if you like this feature you have to still do it manually until the developers decide to provide this feature in the API.
Saving projects
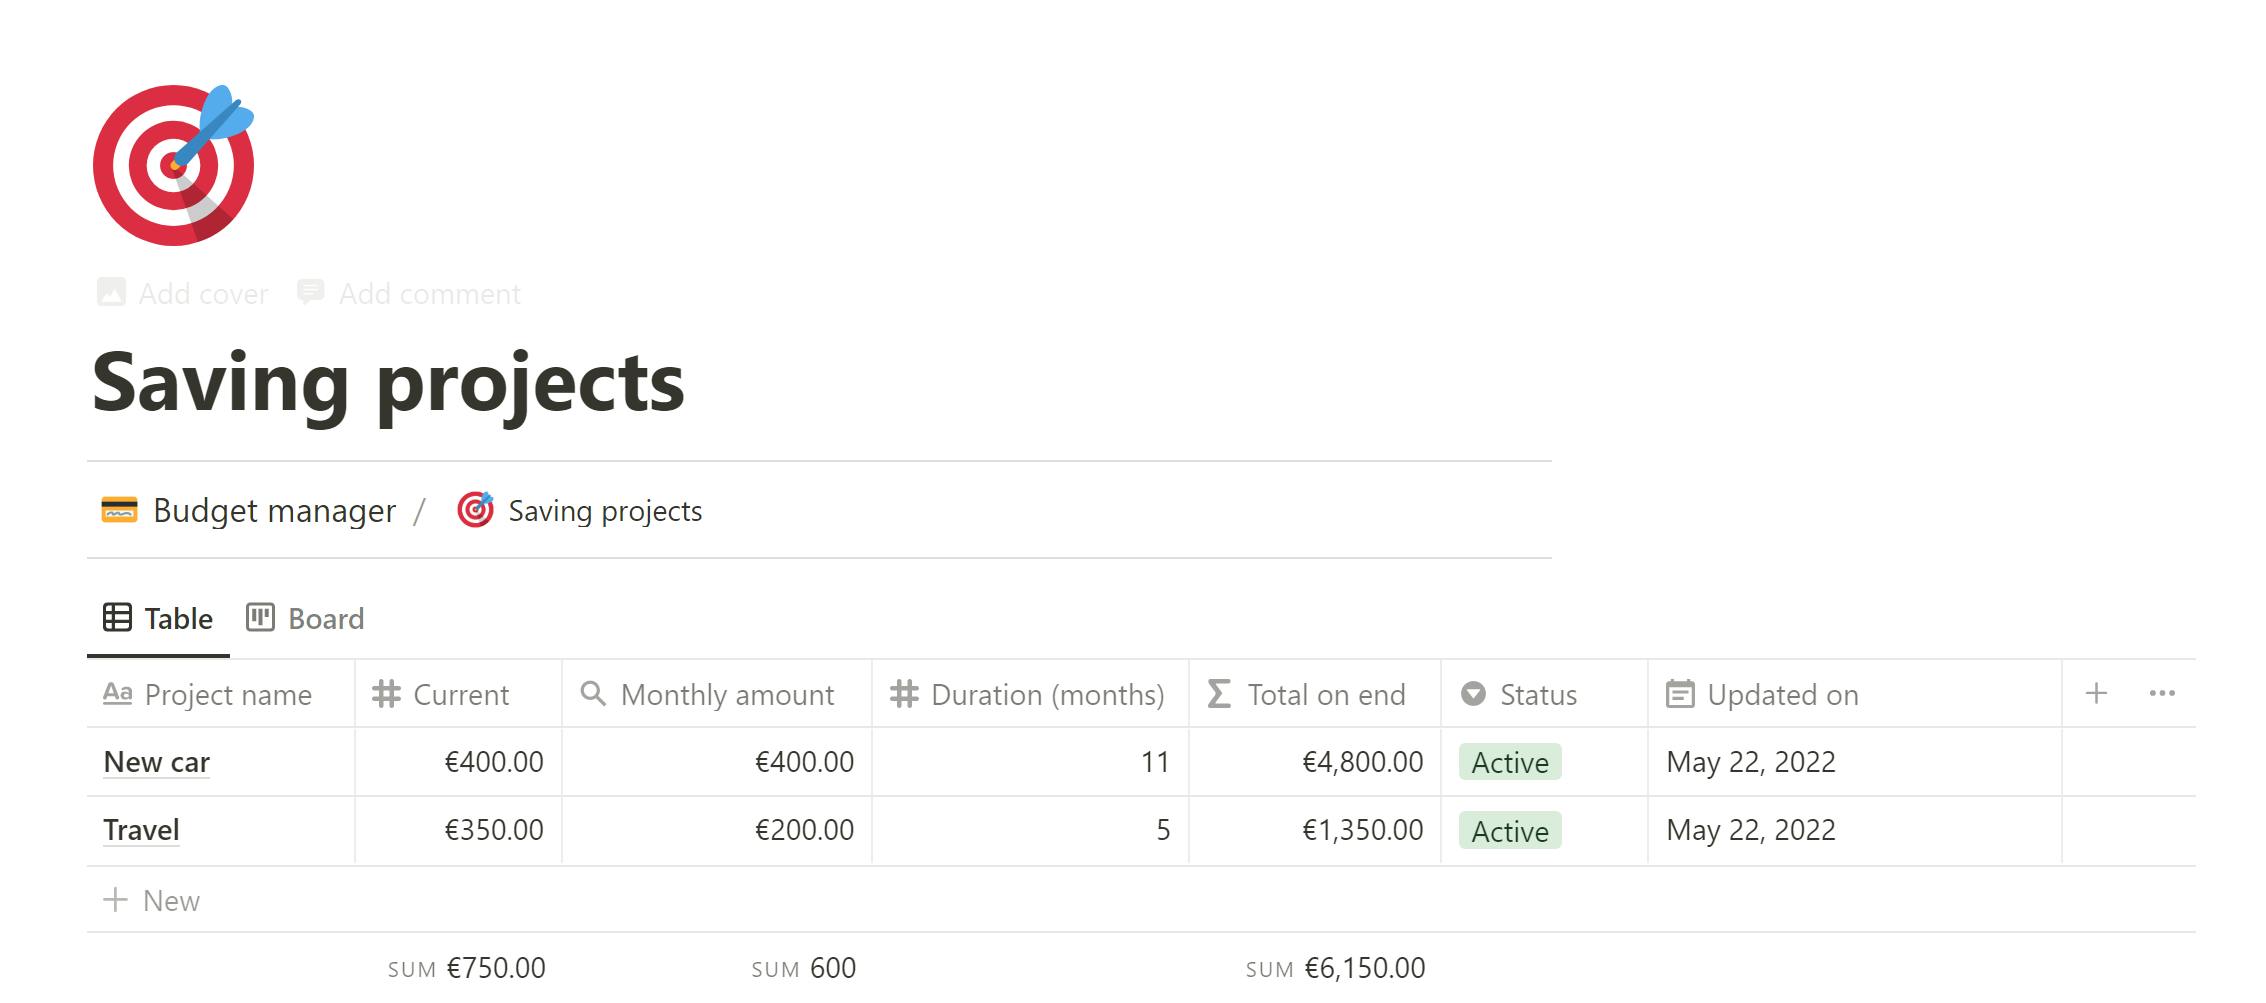
If you have big purchases planned, like a car or a vacation, it is usually a good idea to save up a bit at times, ideally by setting aside a bit of money each month. Although many online banks have this feature already, I always prefer to have an overview on all my projects in one place.
This page contains a database that will be automated with code for automatic progression and has the following properties:
Project name: the name assigned to the projectCurrent: the current amount stored in the projectDuration (months): the duration of the project as a number of monthsStatus: signals if the project is still active or completedRelated: is a “relation” column on the monthly income partition databaseMonthly amount: is a “rollup” column onRelated, retrieves the monthly amount allocated for the projectTotal on end: a formula that calculates the total amount by summing the current amount and the monthly amount multiplied by the durationUpdated on: a date column, necessary for code automation that signals when the record was last updated
Aggregation function on various columns allow you to see the total amounts saved both currently and on finish. If you wish to maintain a sort of archive of projects, instead of deleting them, you can leave them on “completed” status and filter the database for only active projects, so that only these will be shown.
Conclusion
That's the end of the template building part 😉
In the next article I'm going to show you how you can automate some tasks and obtain a beautiful dashboard with Python. See you soon!